
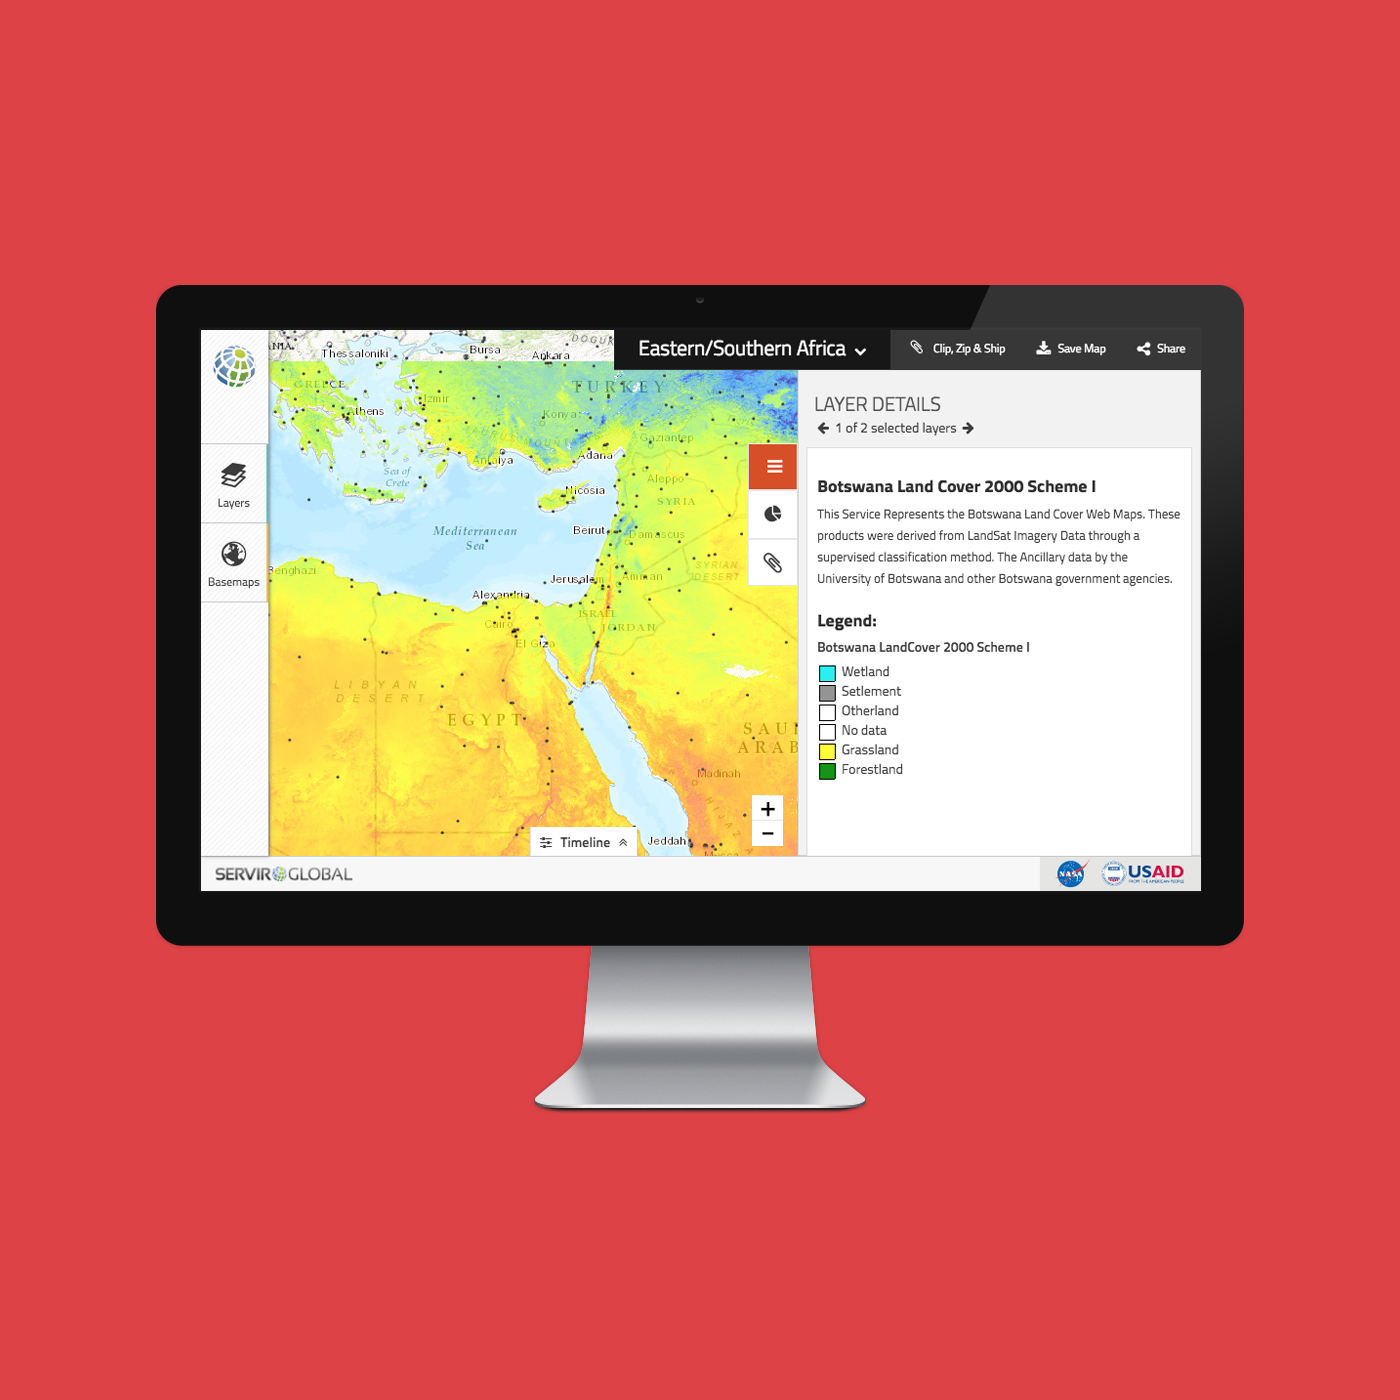
The Servir GeoPortal is a collaboration between NASA, USAID and our team at SpatialDev to create one place where data from dispersed sources can be uploaded, visualized, analyzed and exported.
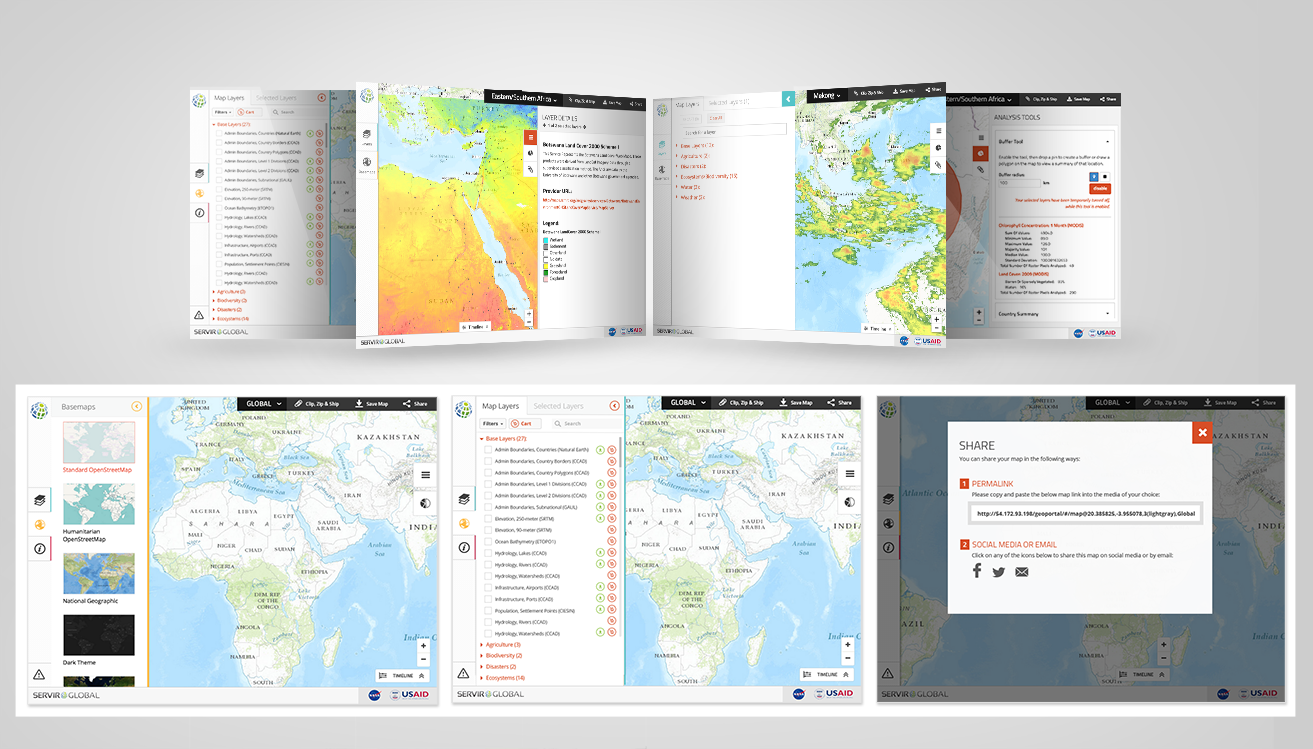
We designed and built an interactive map, where users can choose to visualize the datasets by region as well as filter the data shown on the map according to their analysis needs.
We designed and built an interactive map, where users can choose to visualize the datasets by region as well as filter the data shown on the map according to their analysis needs.
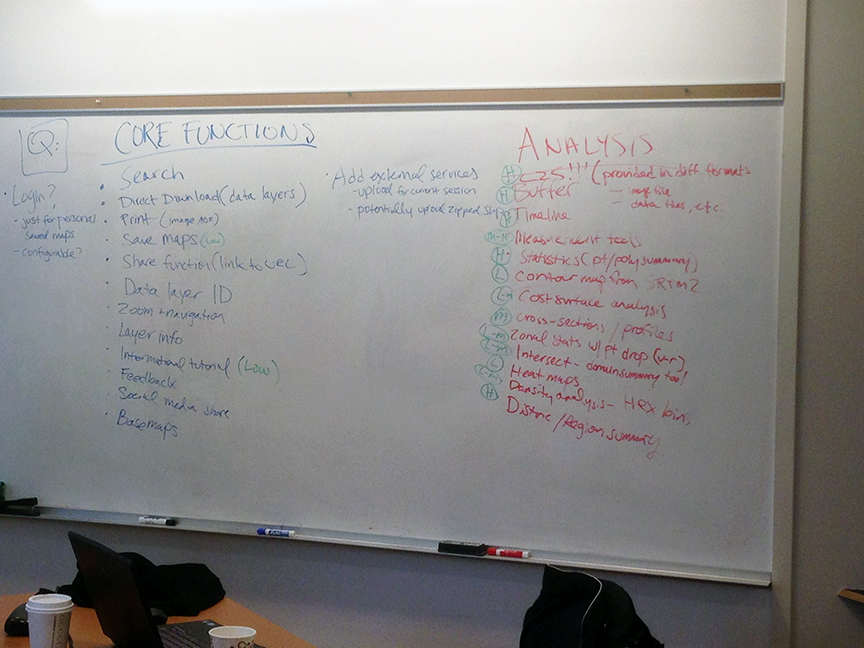
As with many of our projects, we started with a requirements gathering and design workshop, where we were able to identify the objectives, the core functionality, the targeted users and the userflow of the experience as a whole.
We identified the primary users as being the internal USAID team. We found that some users were non-technical people at a higher level management role, who would share these visualizations with regional ministries and governments.
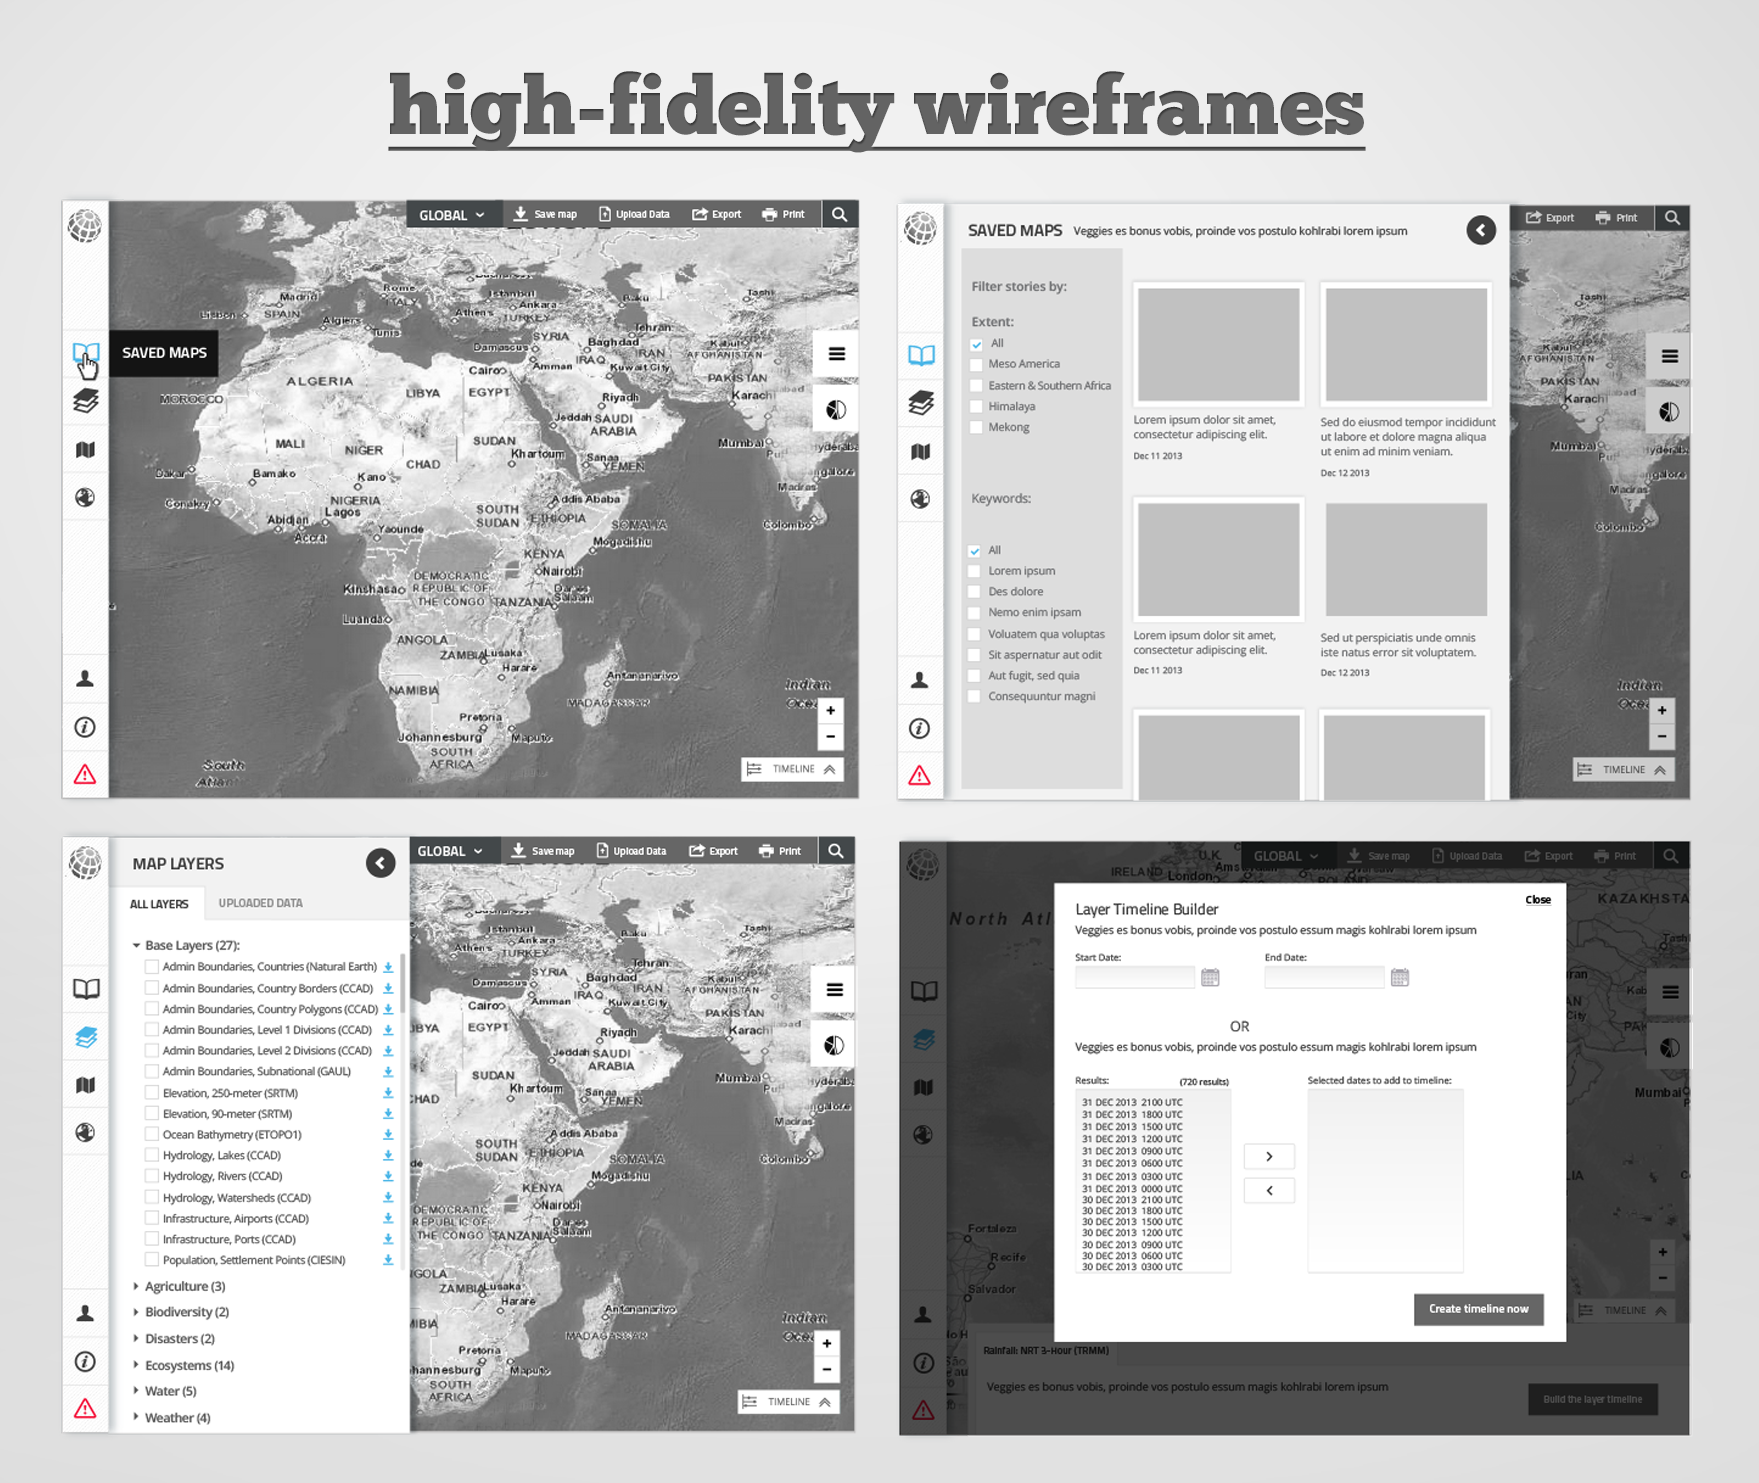
The other type of primary users were the more tech-savvy specialists, as well as scientists and researchers, who use this tool to help them visualize datasets and put together analysis and data summaries. After the workshop and more discovery and research, I was able to capture our findings with initial rough wireframes and eventually translate them to high-fidelity wireframes.
We identified the primary users as being the internal USAID team. We found that some users were non-technical people at a higher level management role, who would share these visualizations with regional ministries and governments.
The other type of primary users were the more tech-savvy specialists, as well as scientists and researchers, who use this tool to help them visualize datasets and put together analysis and data summaries. After the workshop and more discovery and research, I was able to capture our findings with initial rough wireframes and eventually translate them to high-fidelity wireframes.
Some of the analysis portion of this tool is robust and allows features such as letting the user define the geographic area they are interested in analyzing, as well as providing the ability to produce summaries such as buffer summary, cost surface summary, cost surface and region summaries.
CMS tool
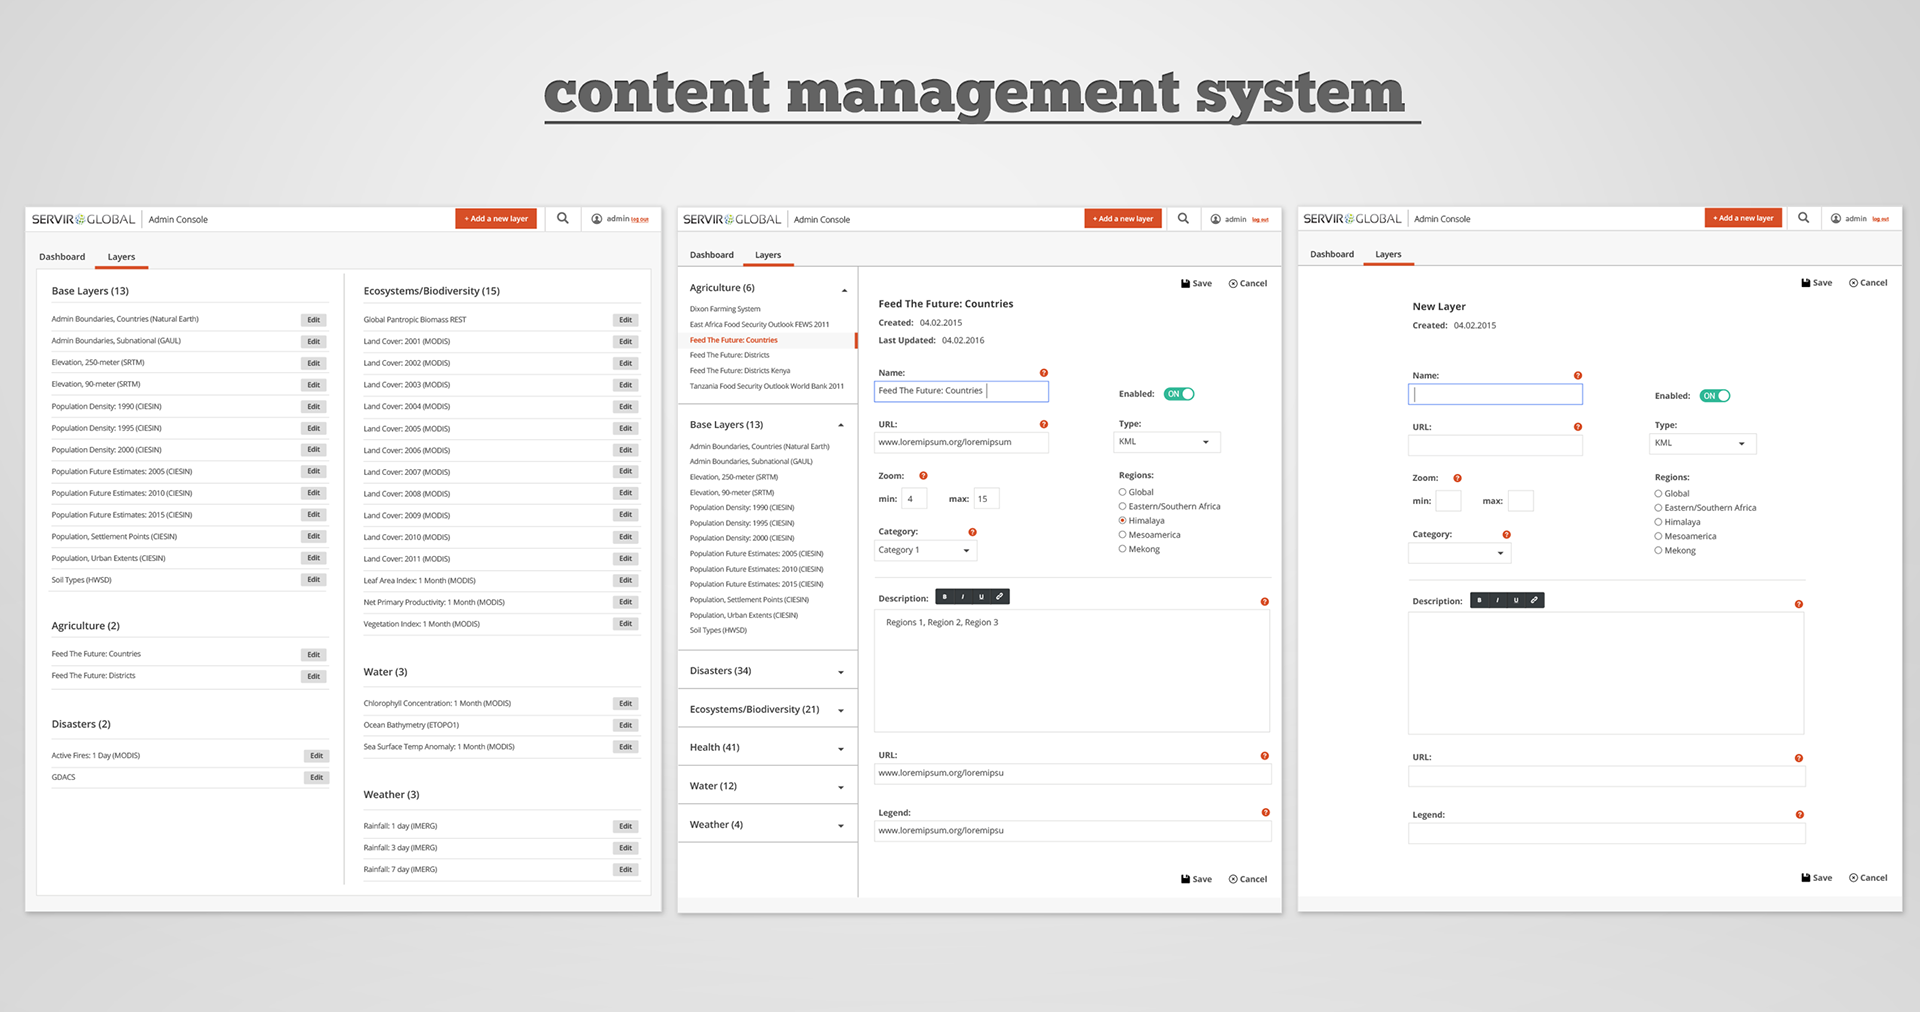
Part of our deliverables was to design and build a custom content management (CMS) for the Geoportal that allows the USAID and NASA non-technical administrators to maintain, update and change the data on the site.
This CMS included a dashboard that allows the administrators to have a quick view of the latest activities, the top most popular datasets and the top five most downloaded layers. Administrators can also see the application errors and their location within the site.
The CMS also allows the user to create new map layers, add new filter sections and rename existing datasets and map layers.