

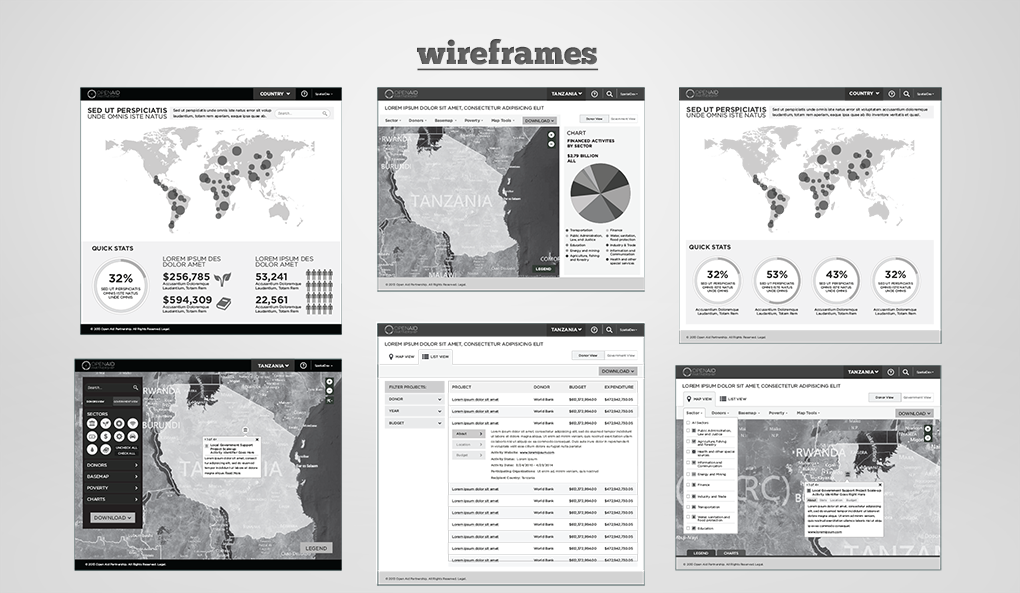
The Open Aid Map provides a platform for World Bank partners to map aid investments across the globe. It is an interactive, web-based system that serves two purposes: to aggregate information on development aid from various sources into a visual format, and to provide governments the capacity to view and analyze their own information on public service delivery.
Visualizations include maps showing project locations and sub-national poverty levels, and charts on aid flows and results. Individual countries have the ability to create their own version of the Open Aid Map and federate data through a common data model so that information can be aggregated both within and between countries. The system relies on open standards for data and data exchange, particularly the International Aid Transparency Initiative (IATI) standard as well as boundary and naming standards for geographic data. The Open Aid Map and its companion data model are completely open source, and are hosted on GitHub.
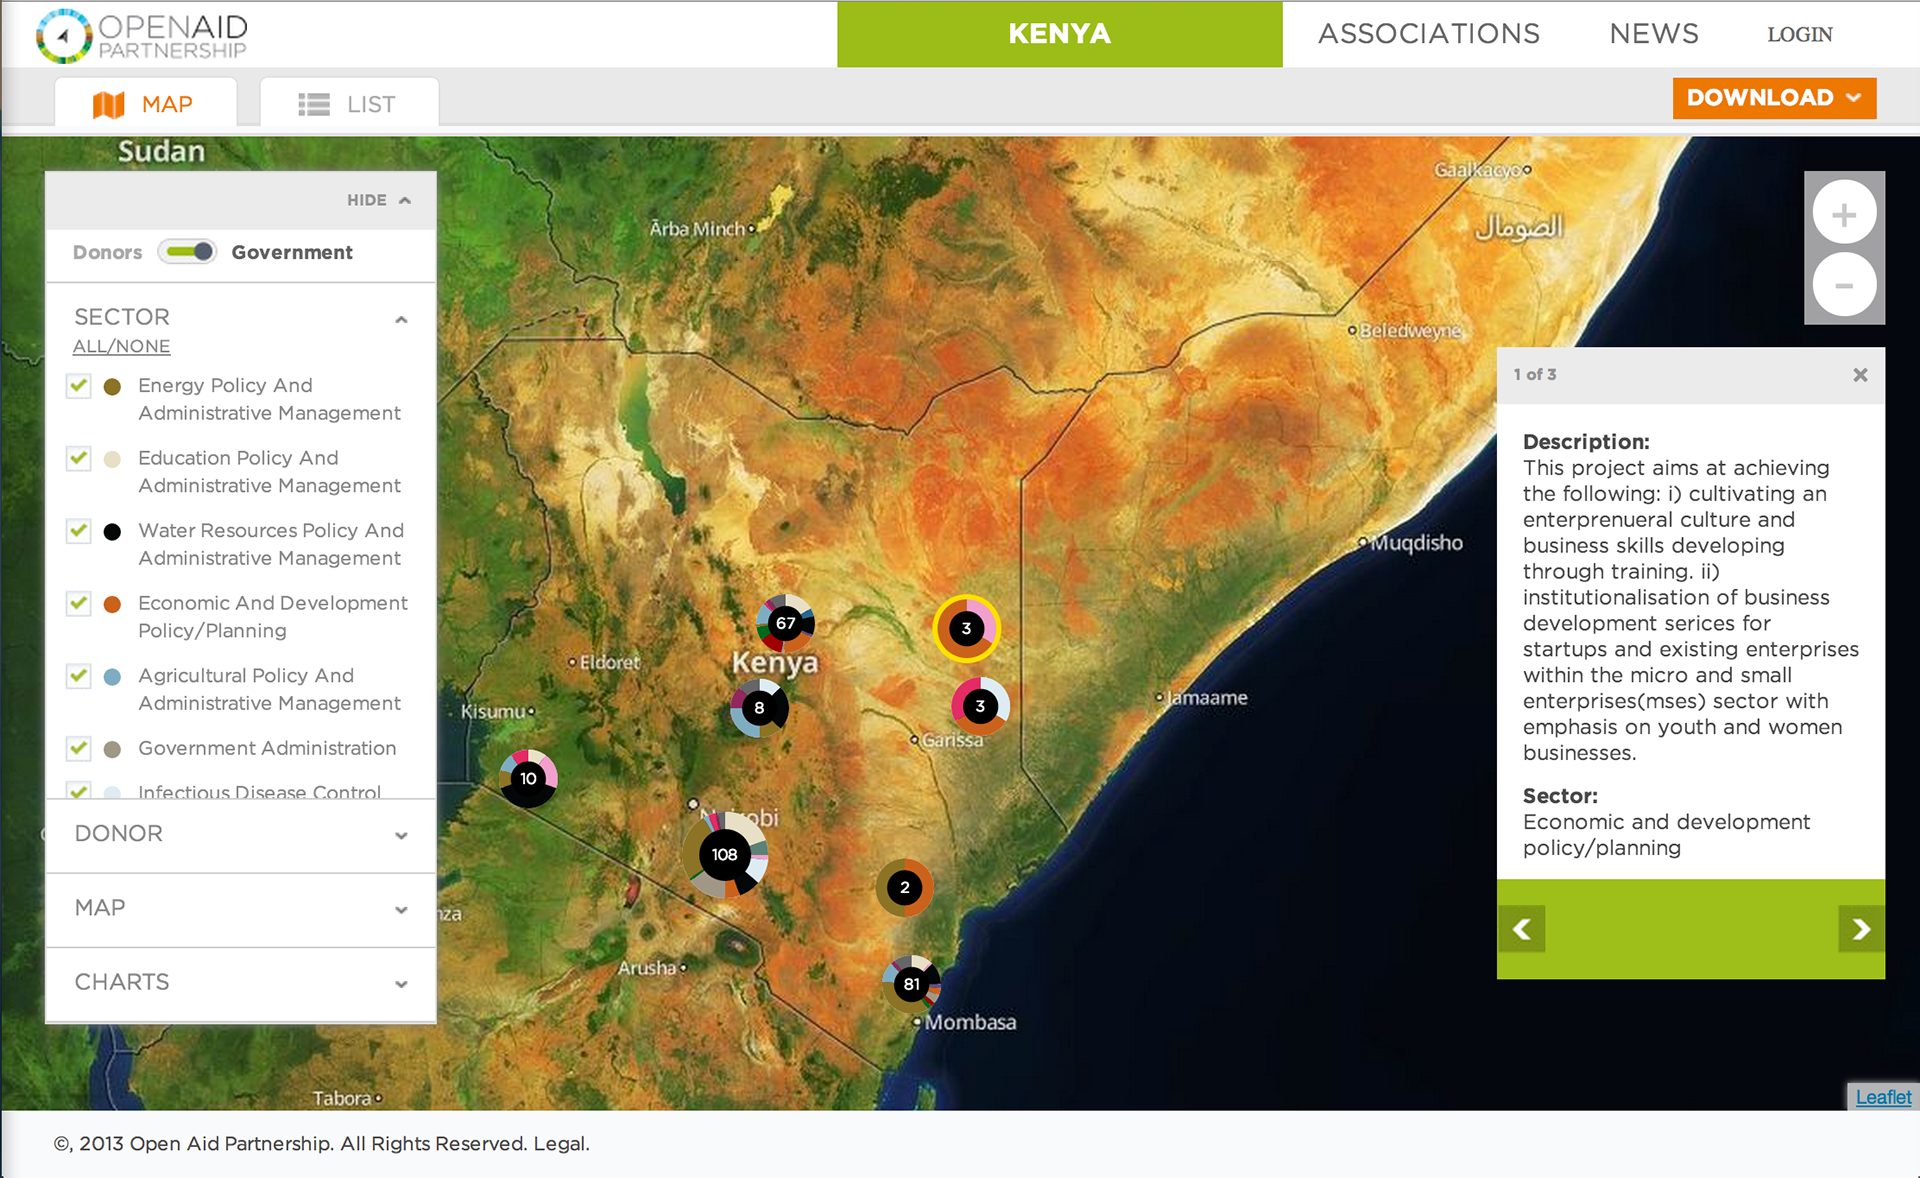
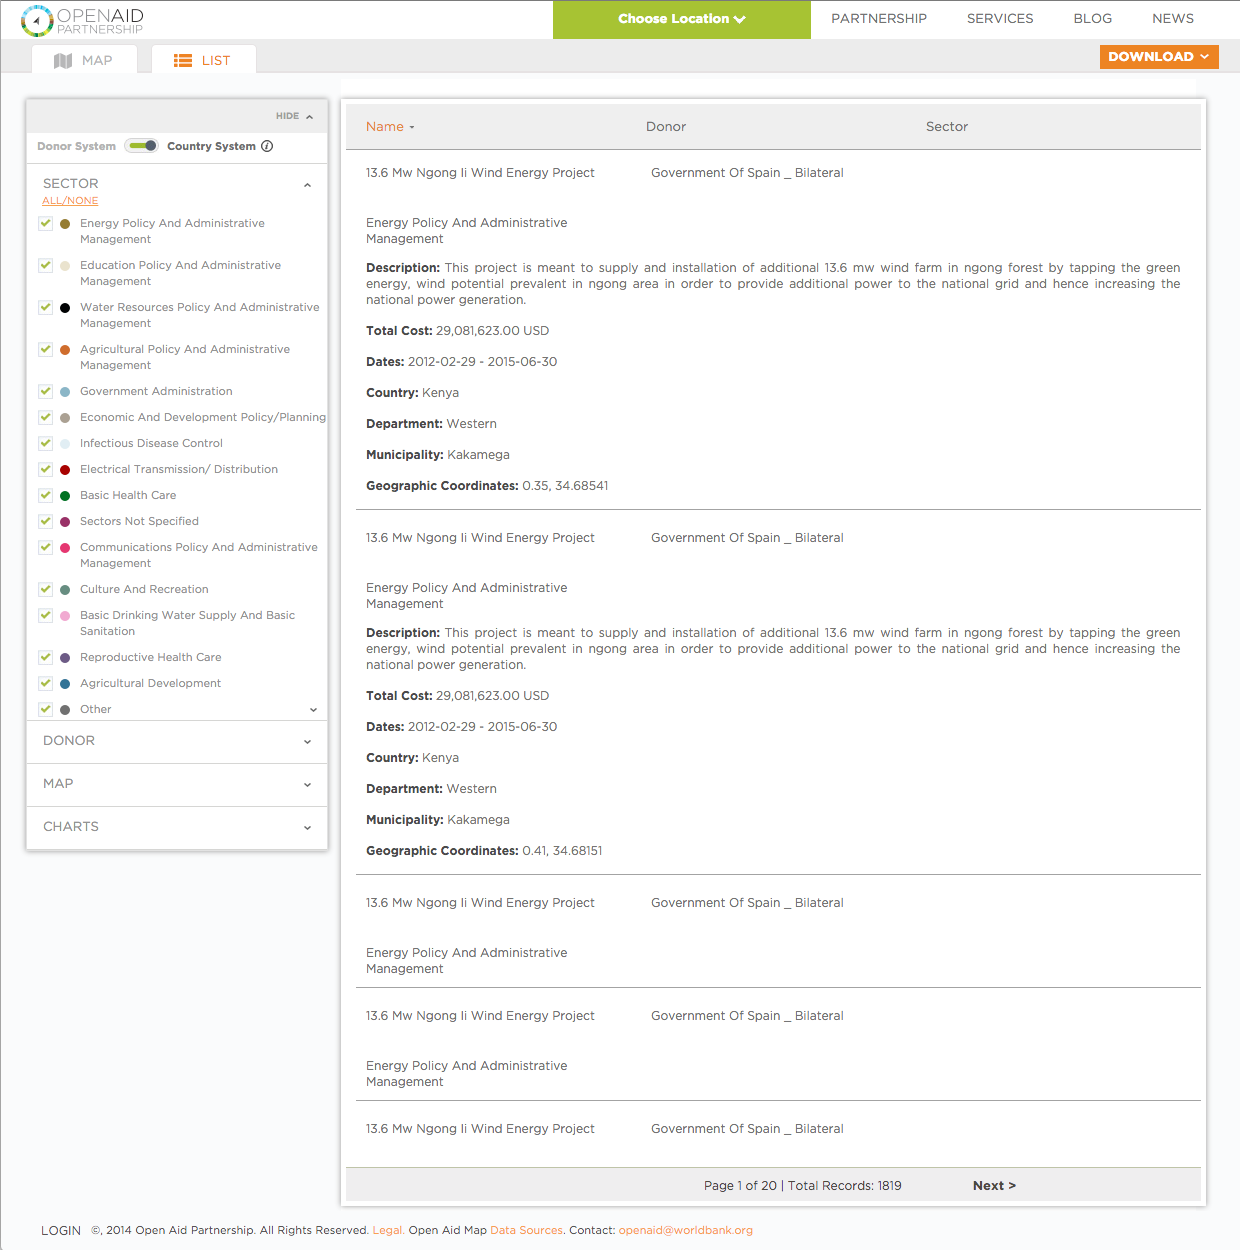
By default, users view the data on the map. Users are able to filter the data they choose to view, whether it is the type of sector or the donor.
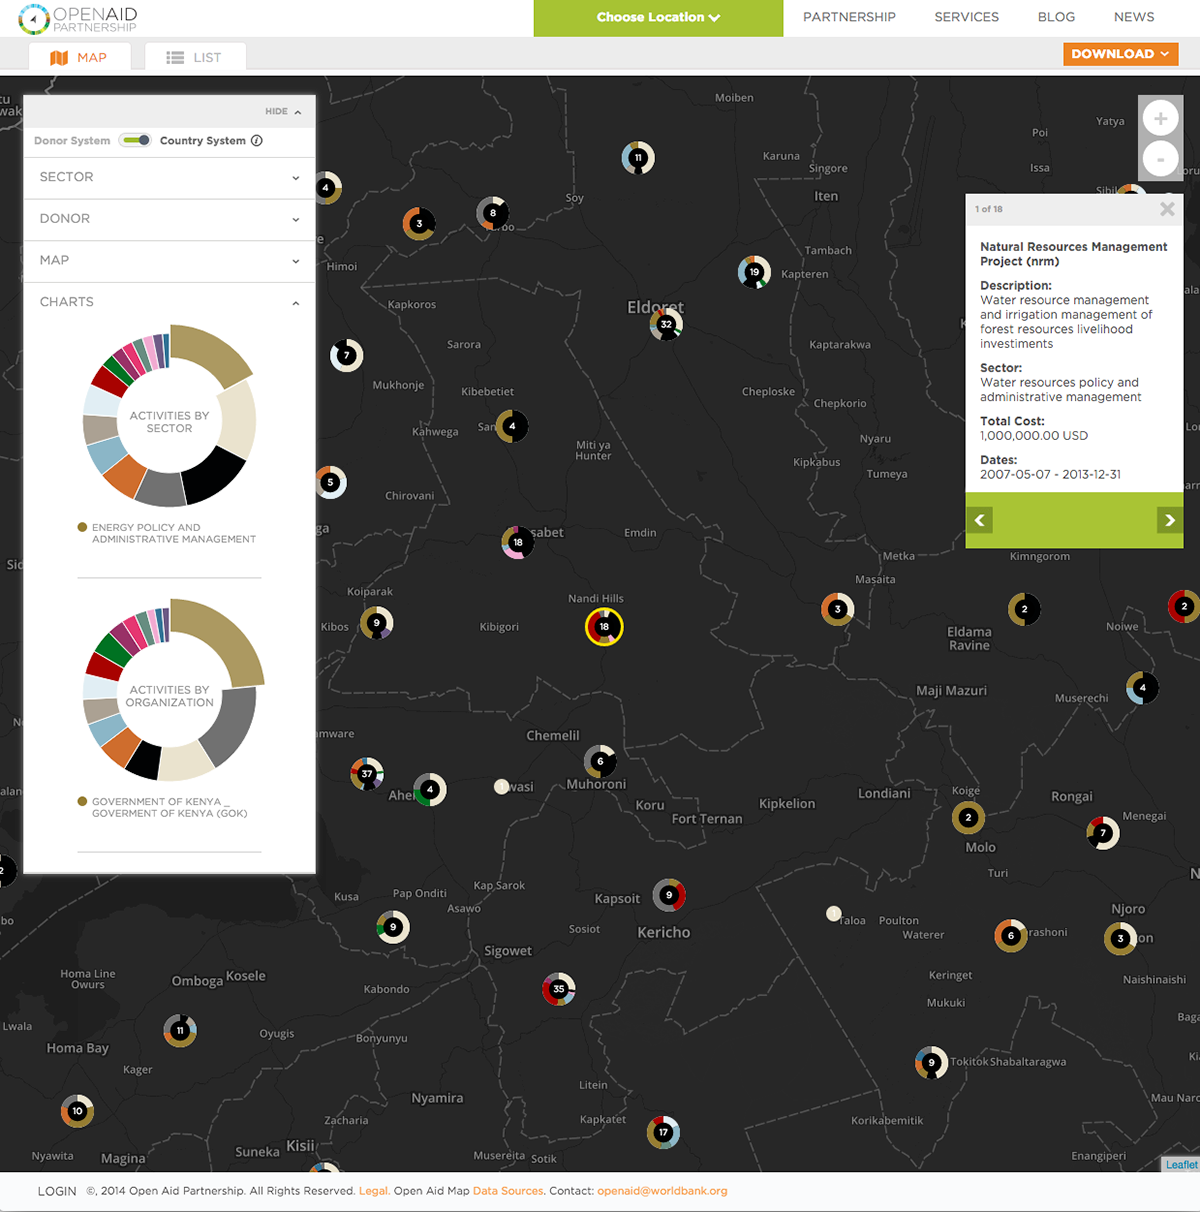
Analysis summaries of the chosen data are created on the fly and presented as graphs that users can then save or export in different formats.
Analysis summaries of the chosen data are created on the fly and presented as graphs that users can then save or export in different formats.
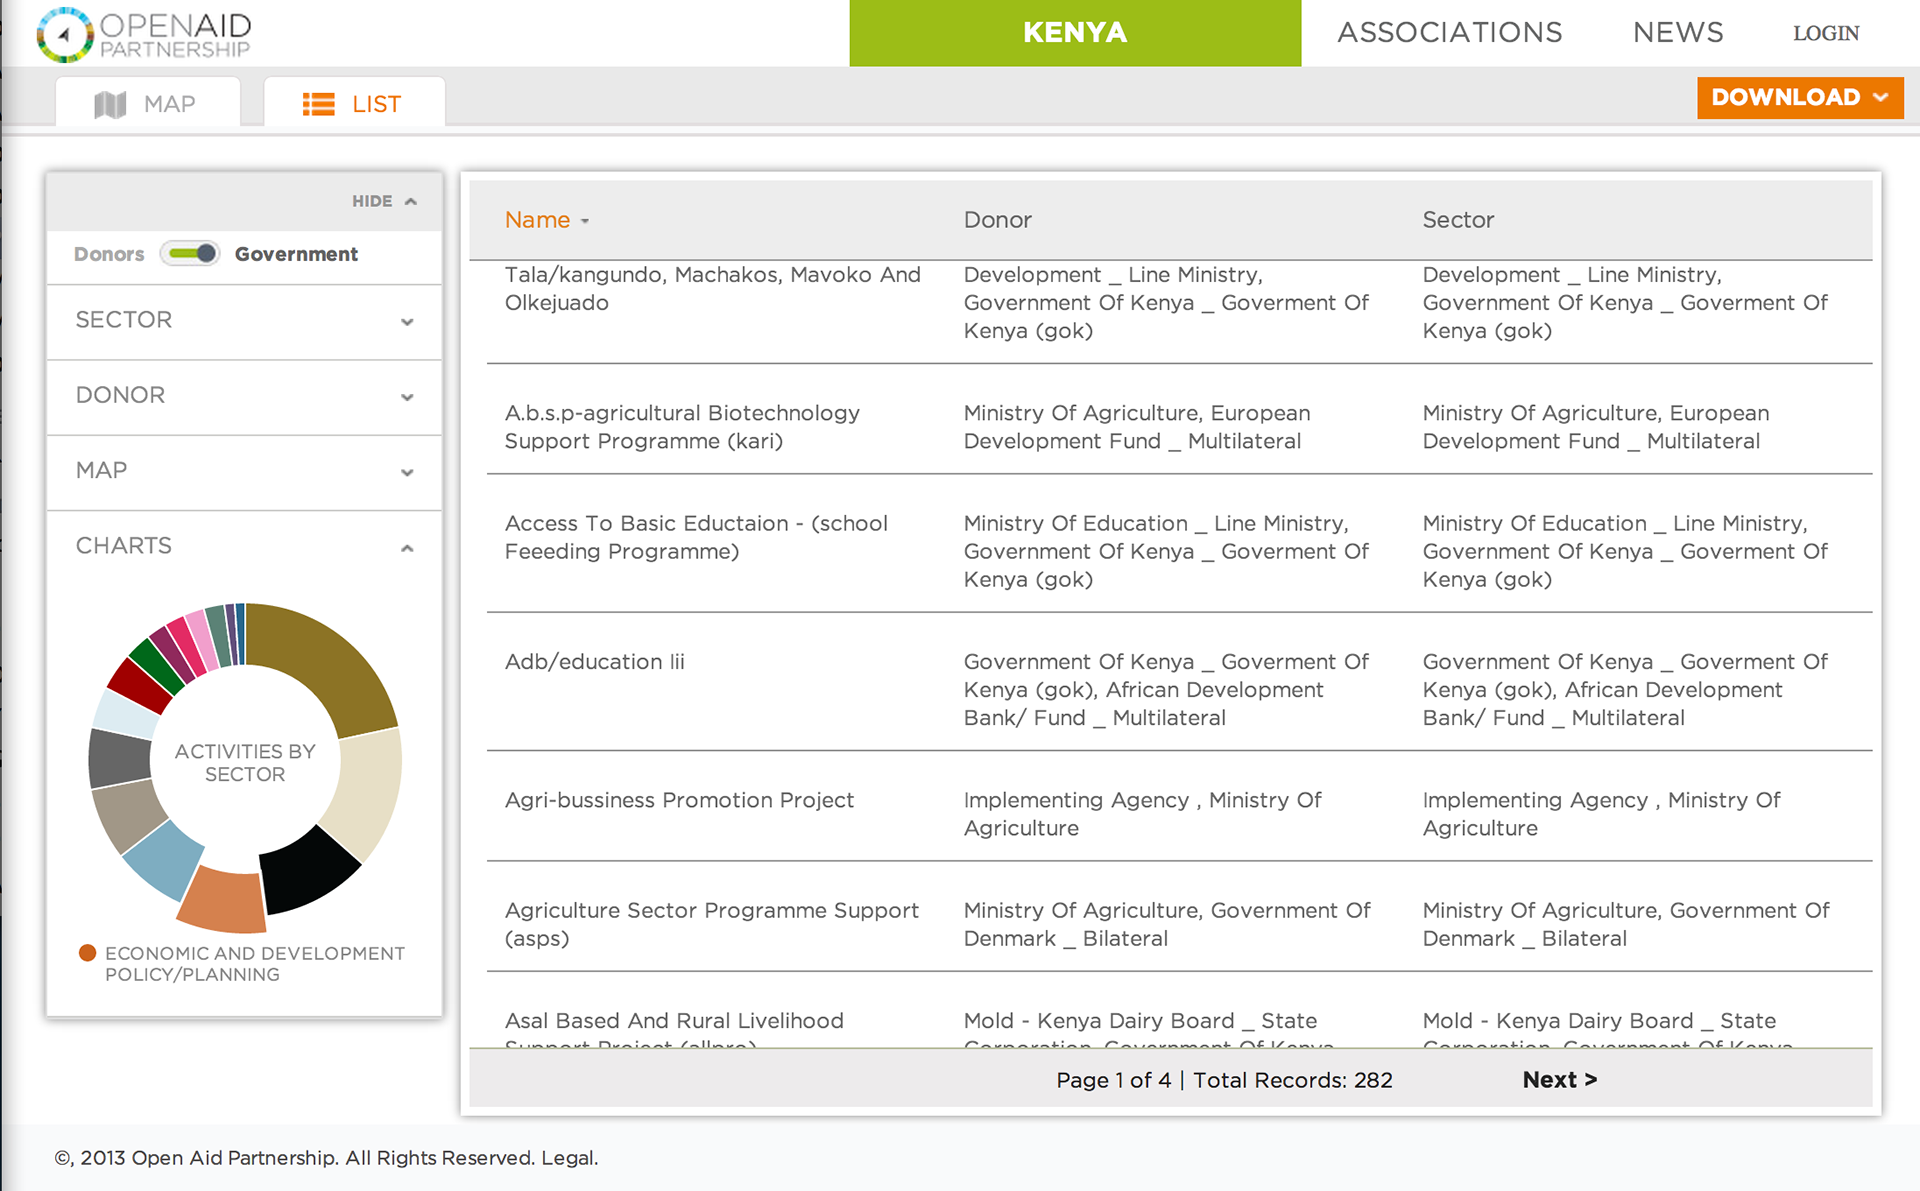
At any point of the experience, the user can opt to view the data as a list, where all the same functionalities of saving, exporting and viewing analysis are available.
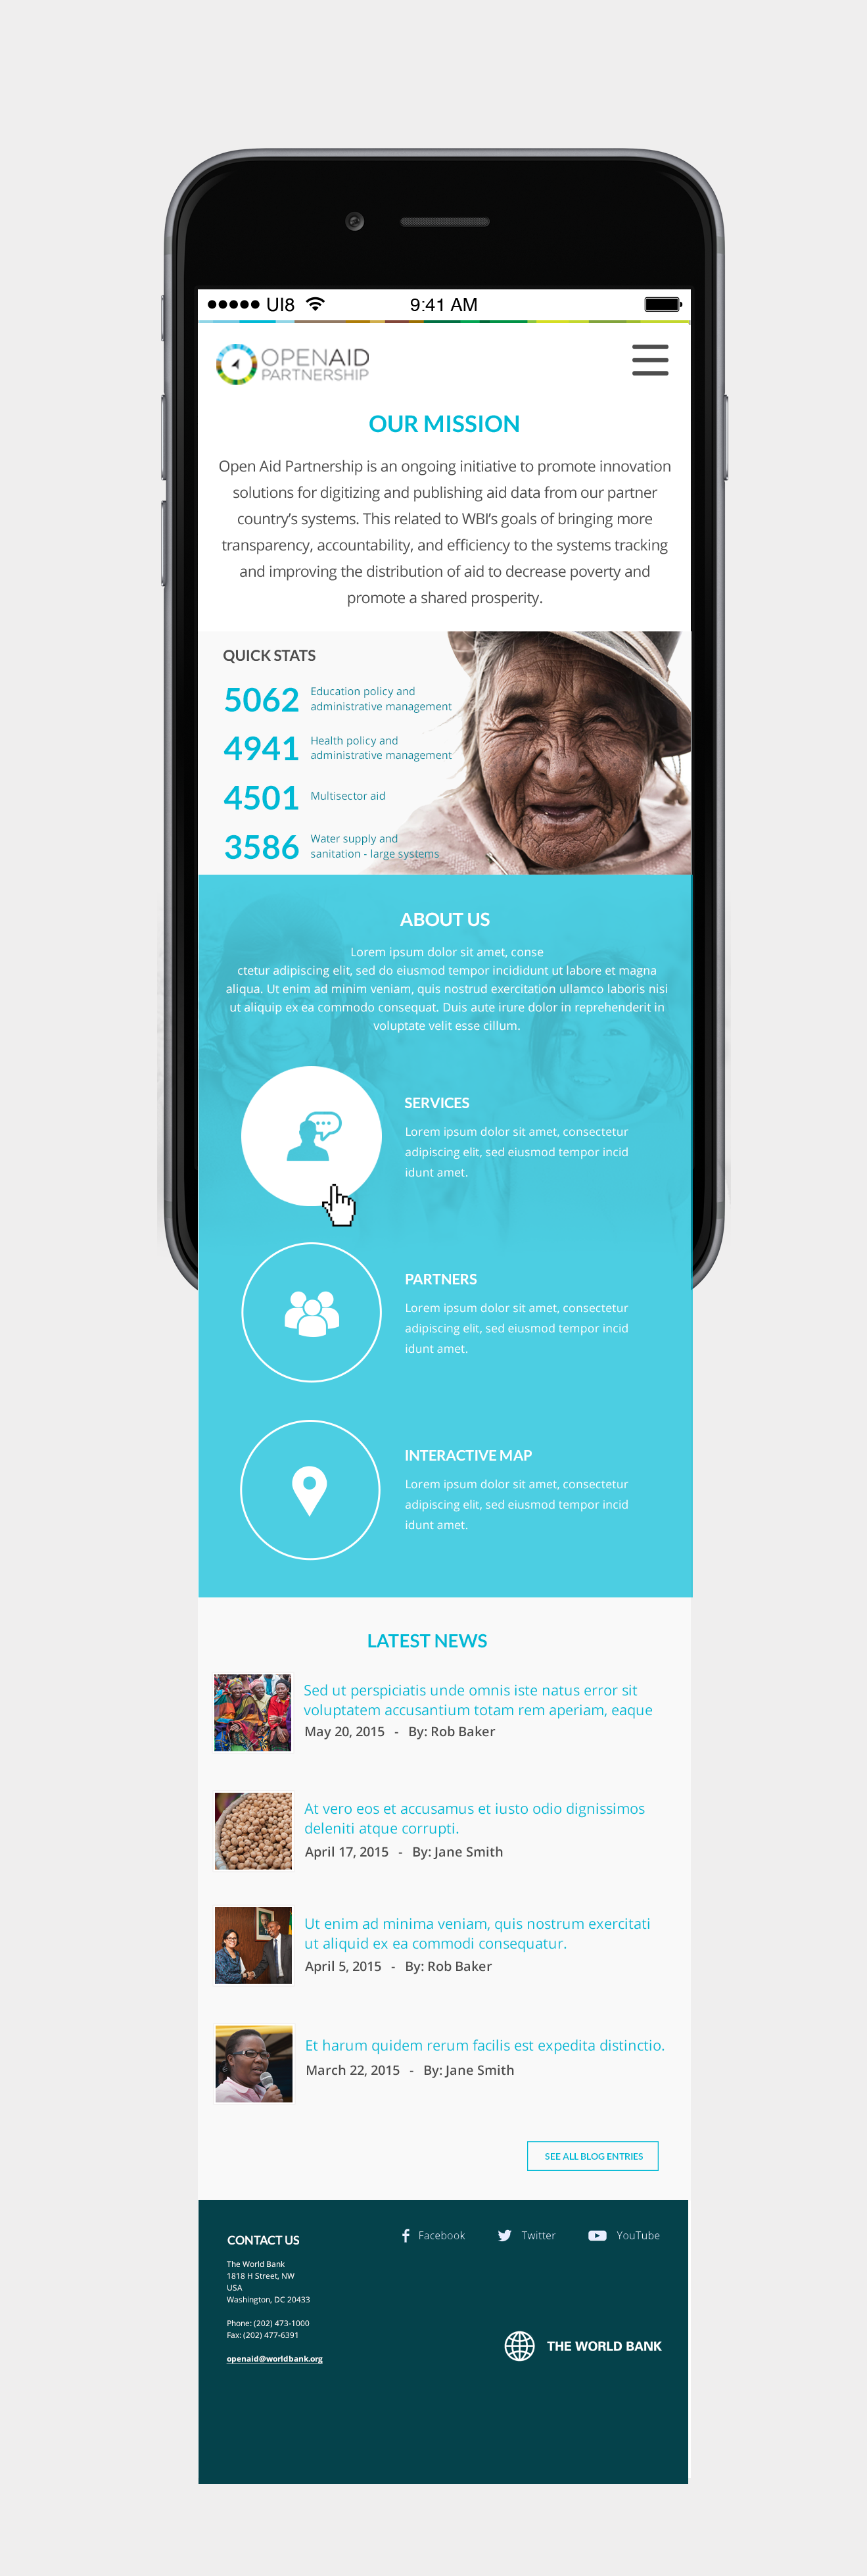
I designed the mobile version of the app with a homepage that is mobile-friendly, (due to budget constraints, we did not develop the mobile version of the website.)