
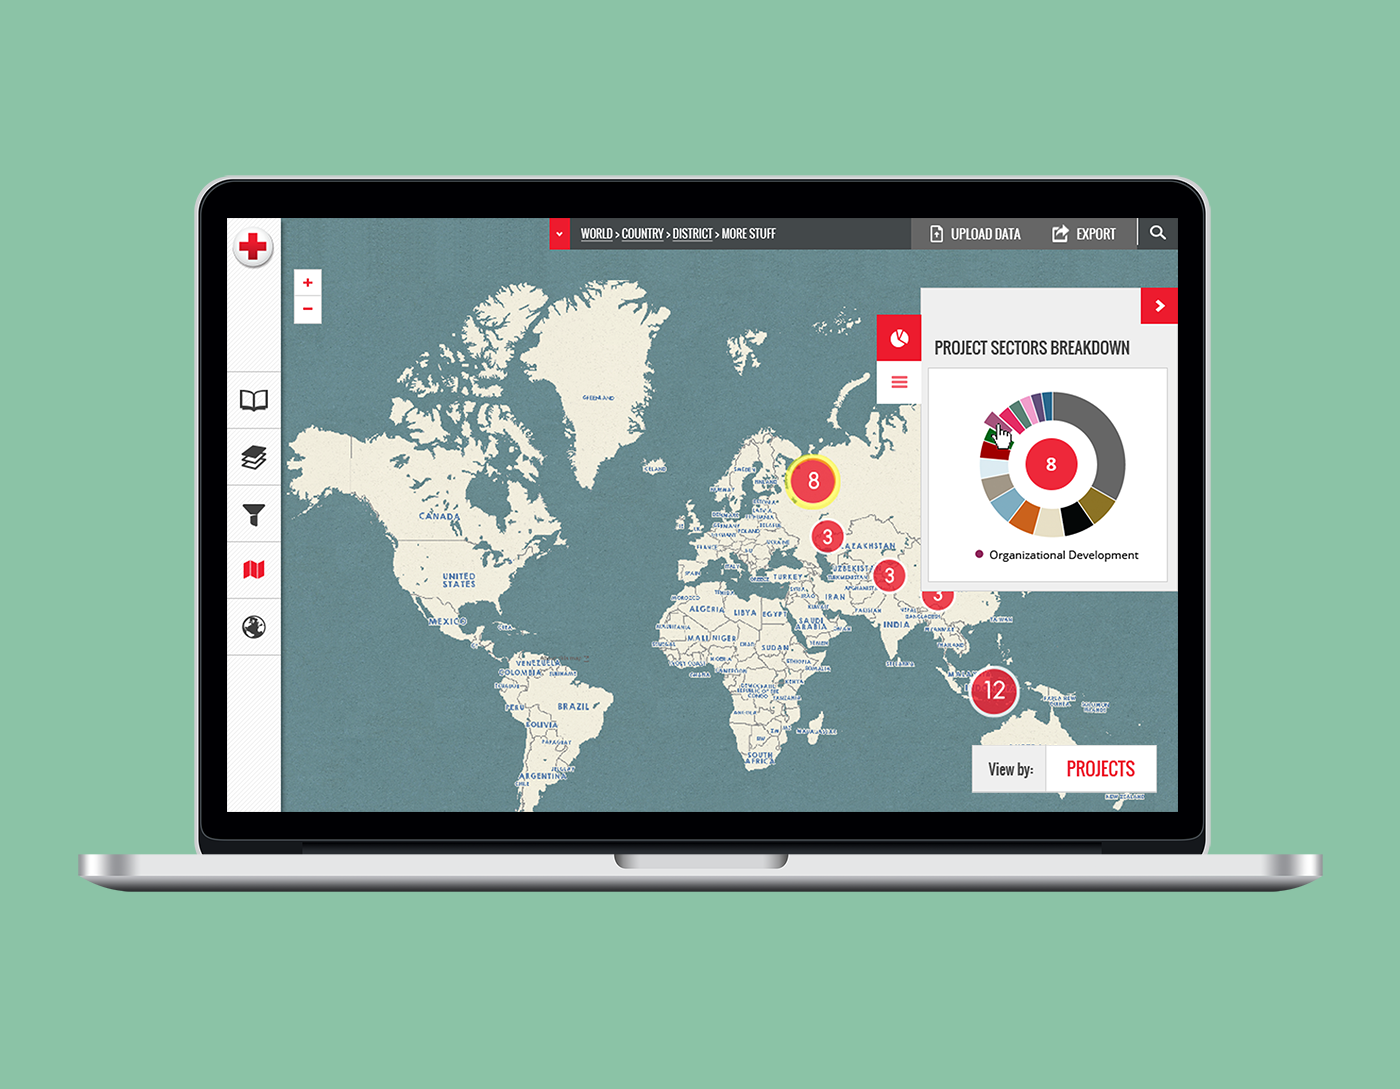
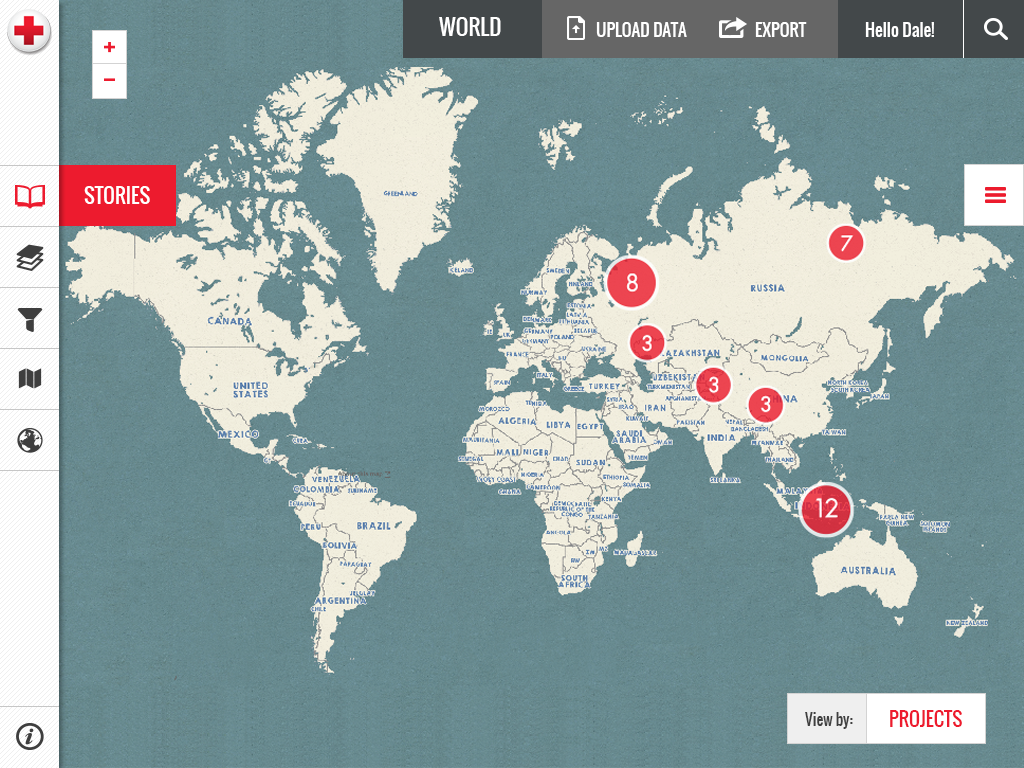
SpatialDev worked closely with the Red Cross International Services Department (ISD) to develop a robust, customized web visualization platform called MapFolio, an application that helps the ISD team visualize and query projects and disasters easily.
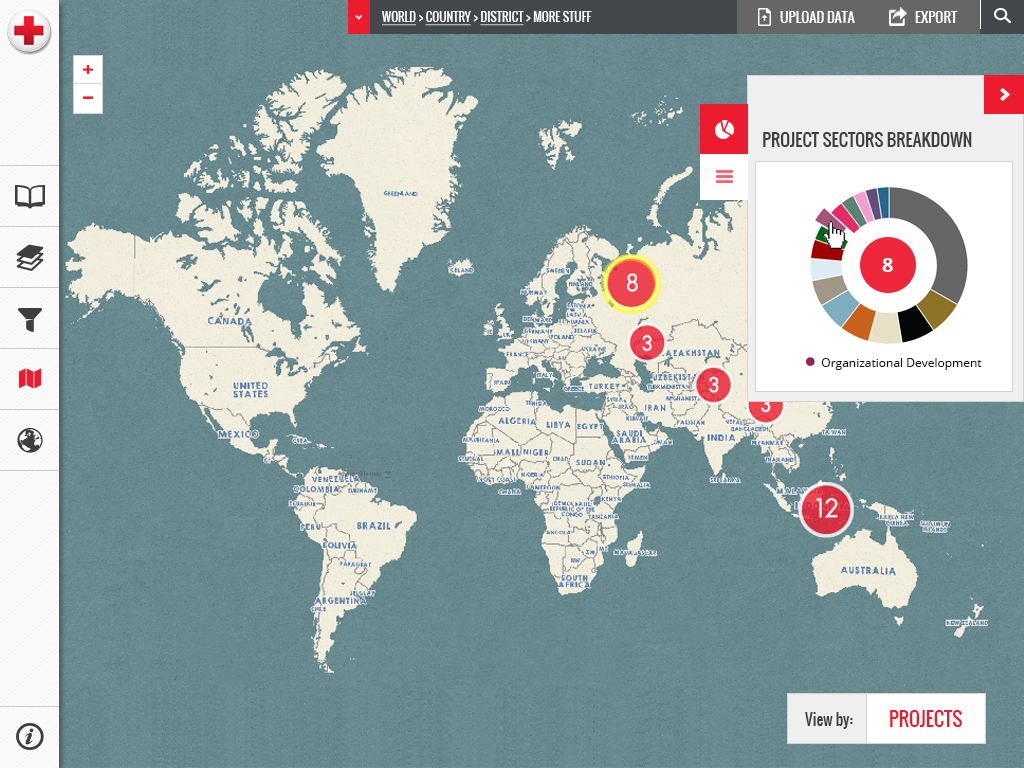
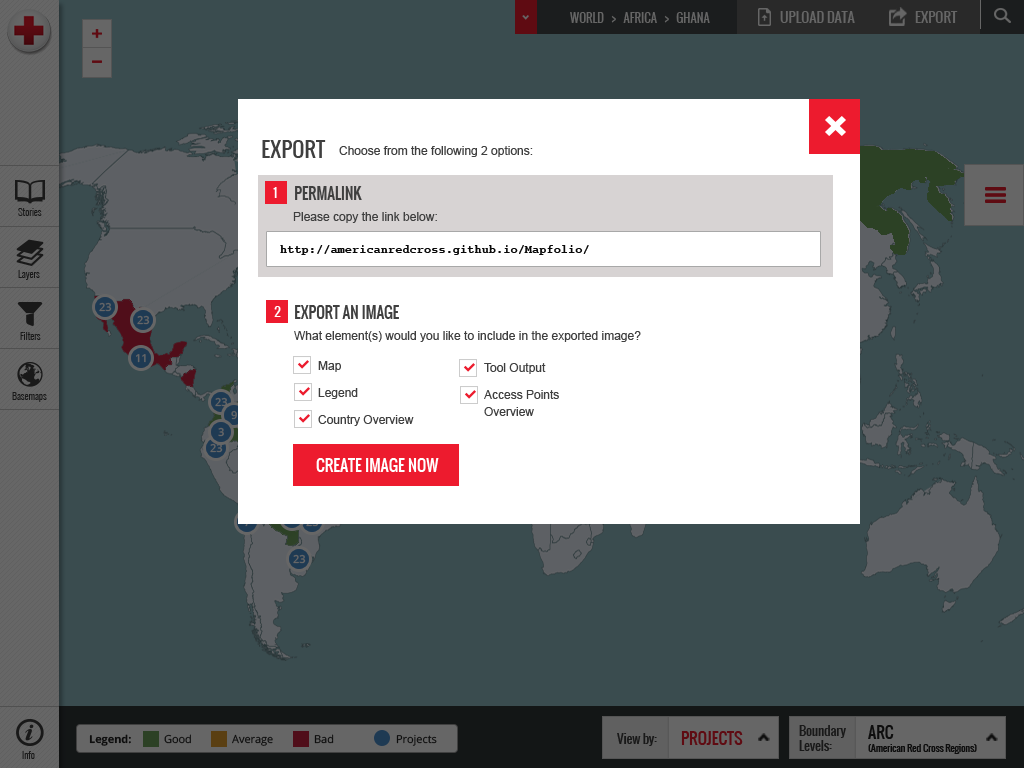
The MapFolio web platform has several unique features including dashboards indicating ISD project health and projects at risk, tools for filtering, sharing and exporting the data in raw form as well as in chart, graph, or map form. Using this new tool, users are able to visualize federated geospatial data located throughout Red Cross International Services in conjunction with spatial and secondary data from the organization’s existing ECOS (Salesforce) system and the Red Cross database.
The MapFolio web platform has several unique features including dashboards indicating ISD project health and projects at risk, tools for filtering, sharing and exporting the data in raw form as well as in chart, graph, or map form. Using this new tool, users are able to visualize federated geospatial data located throughout Red Cross International Services in conjunction with spatial and secondary data from the organization’s existing ECOS (Salesforce) system and the Red Cross database.
My role
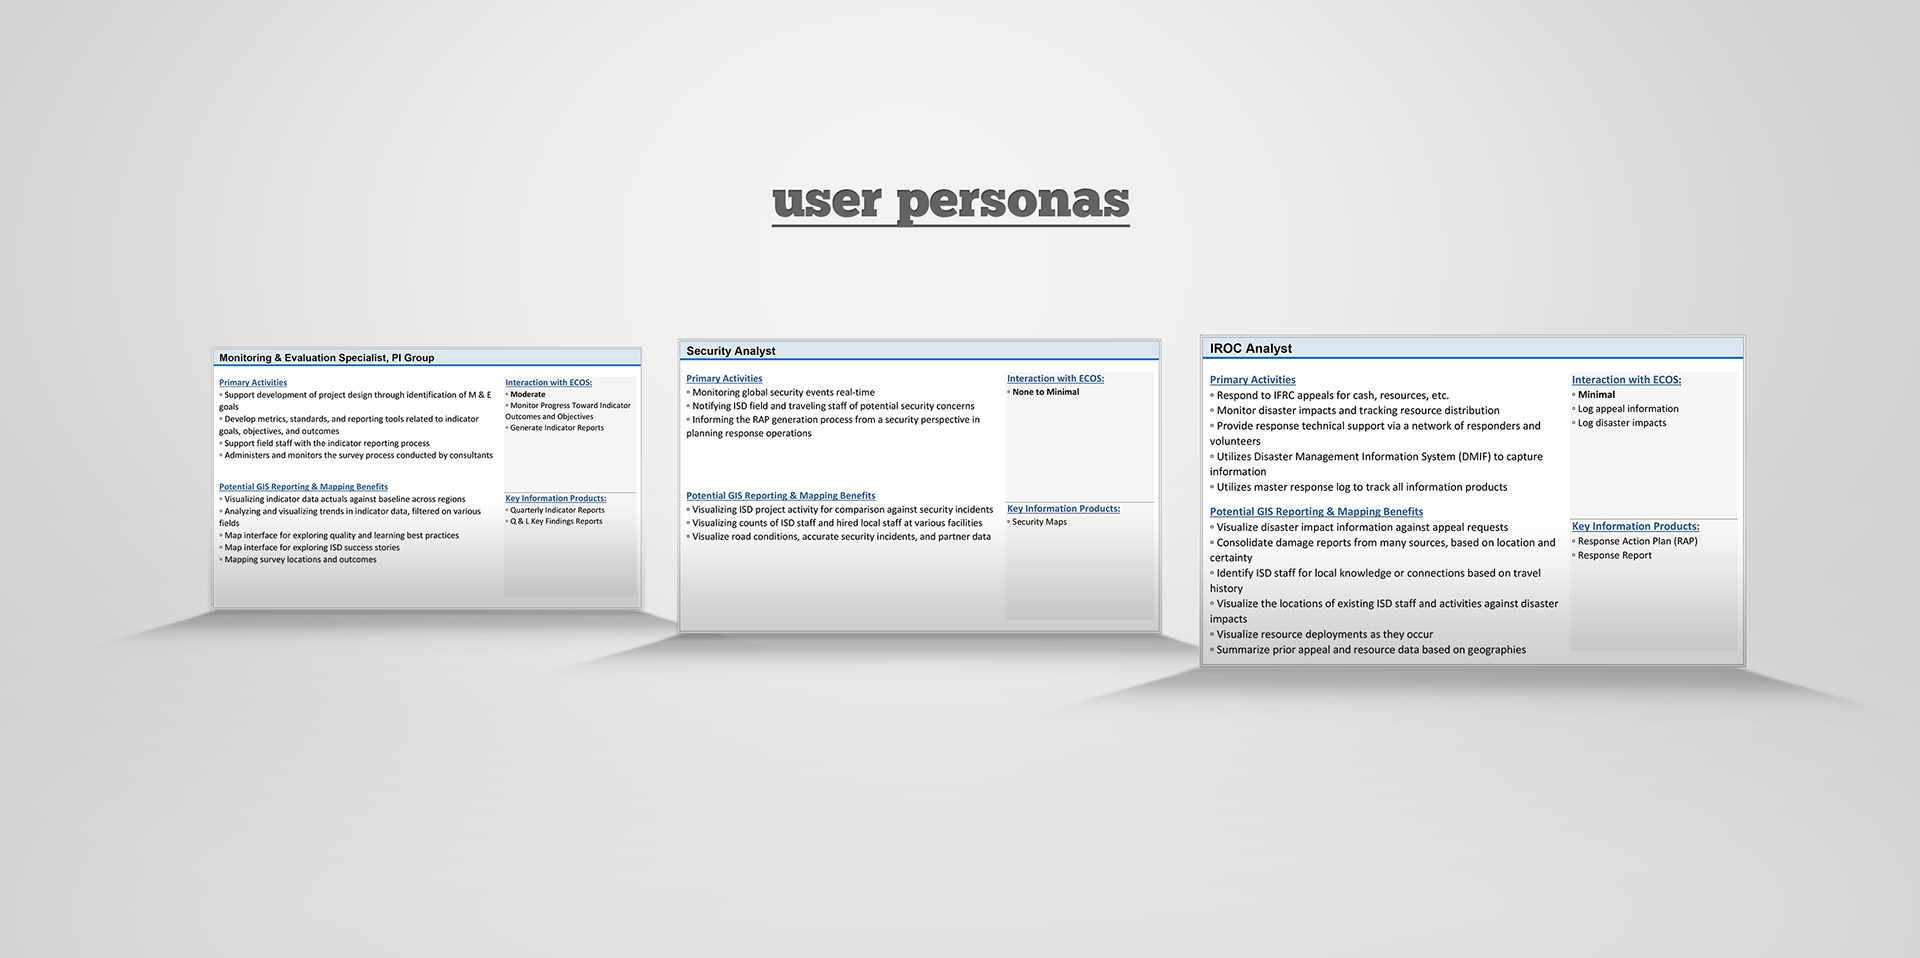
Some of my responsibilities as the Creative Director and UI designer in this project included being part of strategy, discovery and research. I led the design process, which included a design discovery workshop with the client, development of personas, wireframes, userflows and design comps. I supported the software engineers during development and QA, where we worked in an agile, scrum environment.
The American Red Cross approached us to build a mapping visualization tool that will live and leverage the data that is used within Salesforce, their main operational platform (ECOS).
The main users for this visualization tool are the project managers, who go into the platform on a daily basis to view the status of their projects. Other users identified for this tool were decision-makers needing an overview of the current situation or disaster area.
The main users for this visualization tool are the project managers, who go into the platform on a daily basis to view the status of their projects. Other users identified for this tool were decision-makers needing an overview of the current situation or disaster area.
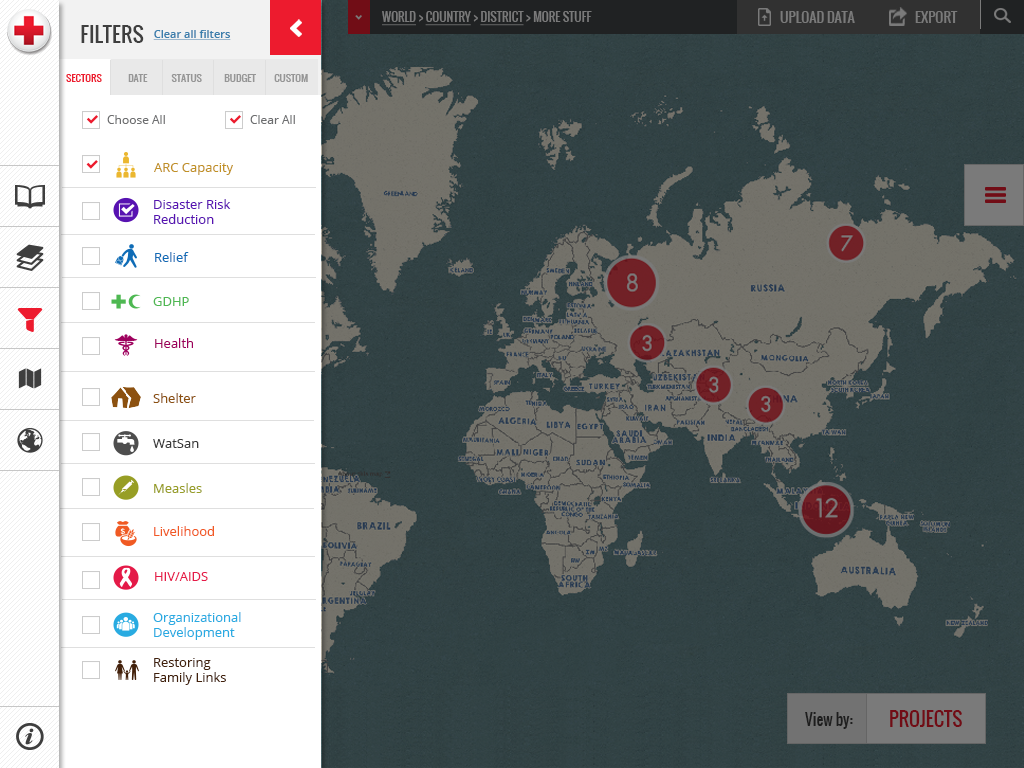
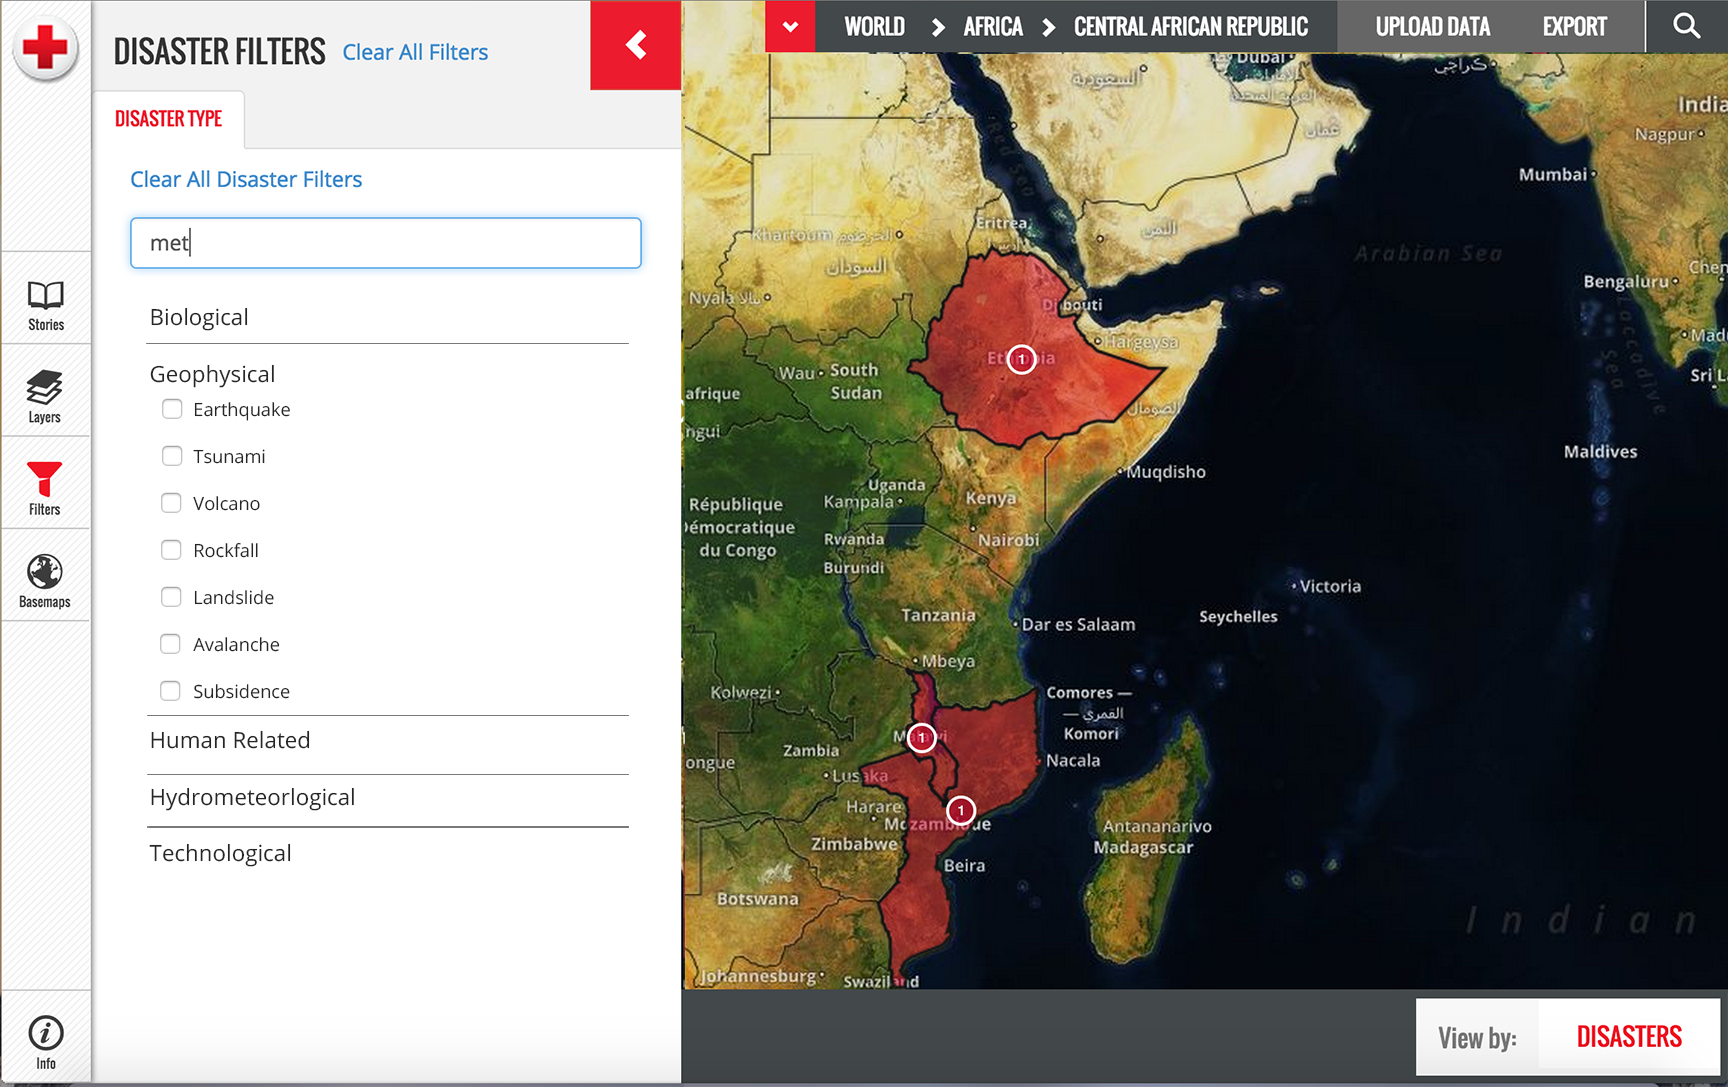
Integrating our map visualization tool into Salesforce proved to be challenging, as it involved connecting to Salesforce and tapping into the existing data within this platform as well as connecting to our own repository so that we can manipulate, search, and display the Salesforce data in Mapfolio.We were able to show different types of data within Mapfolio such as aggregation of disasters and requests for assistance.
We also added filtering capabilities, and the ability to write your own query (for the more technical user).
We also added filtering capabilities, and the ability to write your own query (for the more technical user).

Mapfolio proved to be a very valuable addition to the client's existing platform. Being able to visualize the data on the map and seeing what is needed in real time became crucial for decision making during disasters and conflicts.